
Almost every farmer who starts a piggery does the same thing first: they sit down, sketch some numbers, and convince themselves it's going to work.
And on paper, it usually does. Feed cost times number of pigs, minus what you'll sell them for, equals profit. Simple.
The problem isn't that farmers don't plan. It's that the plan doesn't survive contact with month three.
📉 The Gap Nobody Draws
Take a real example: a farrow-to-finish operation capitalized at UGX 200,000,000 — split evenly between fixed capital (housing, equipment, breeding stock) and operating capital (feed, labour, veterinary costs). Draw it as a straight line, the way most homemade spreadsheets do, and the investment looks recovered by month 20. Model it the way the farm will actually ramp up — slow first cycle, rising feed costs, mortality, gradual buyer relationships — and breakeven doesn't land until month 23.
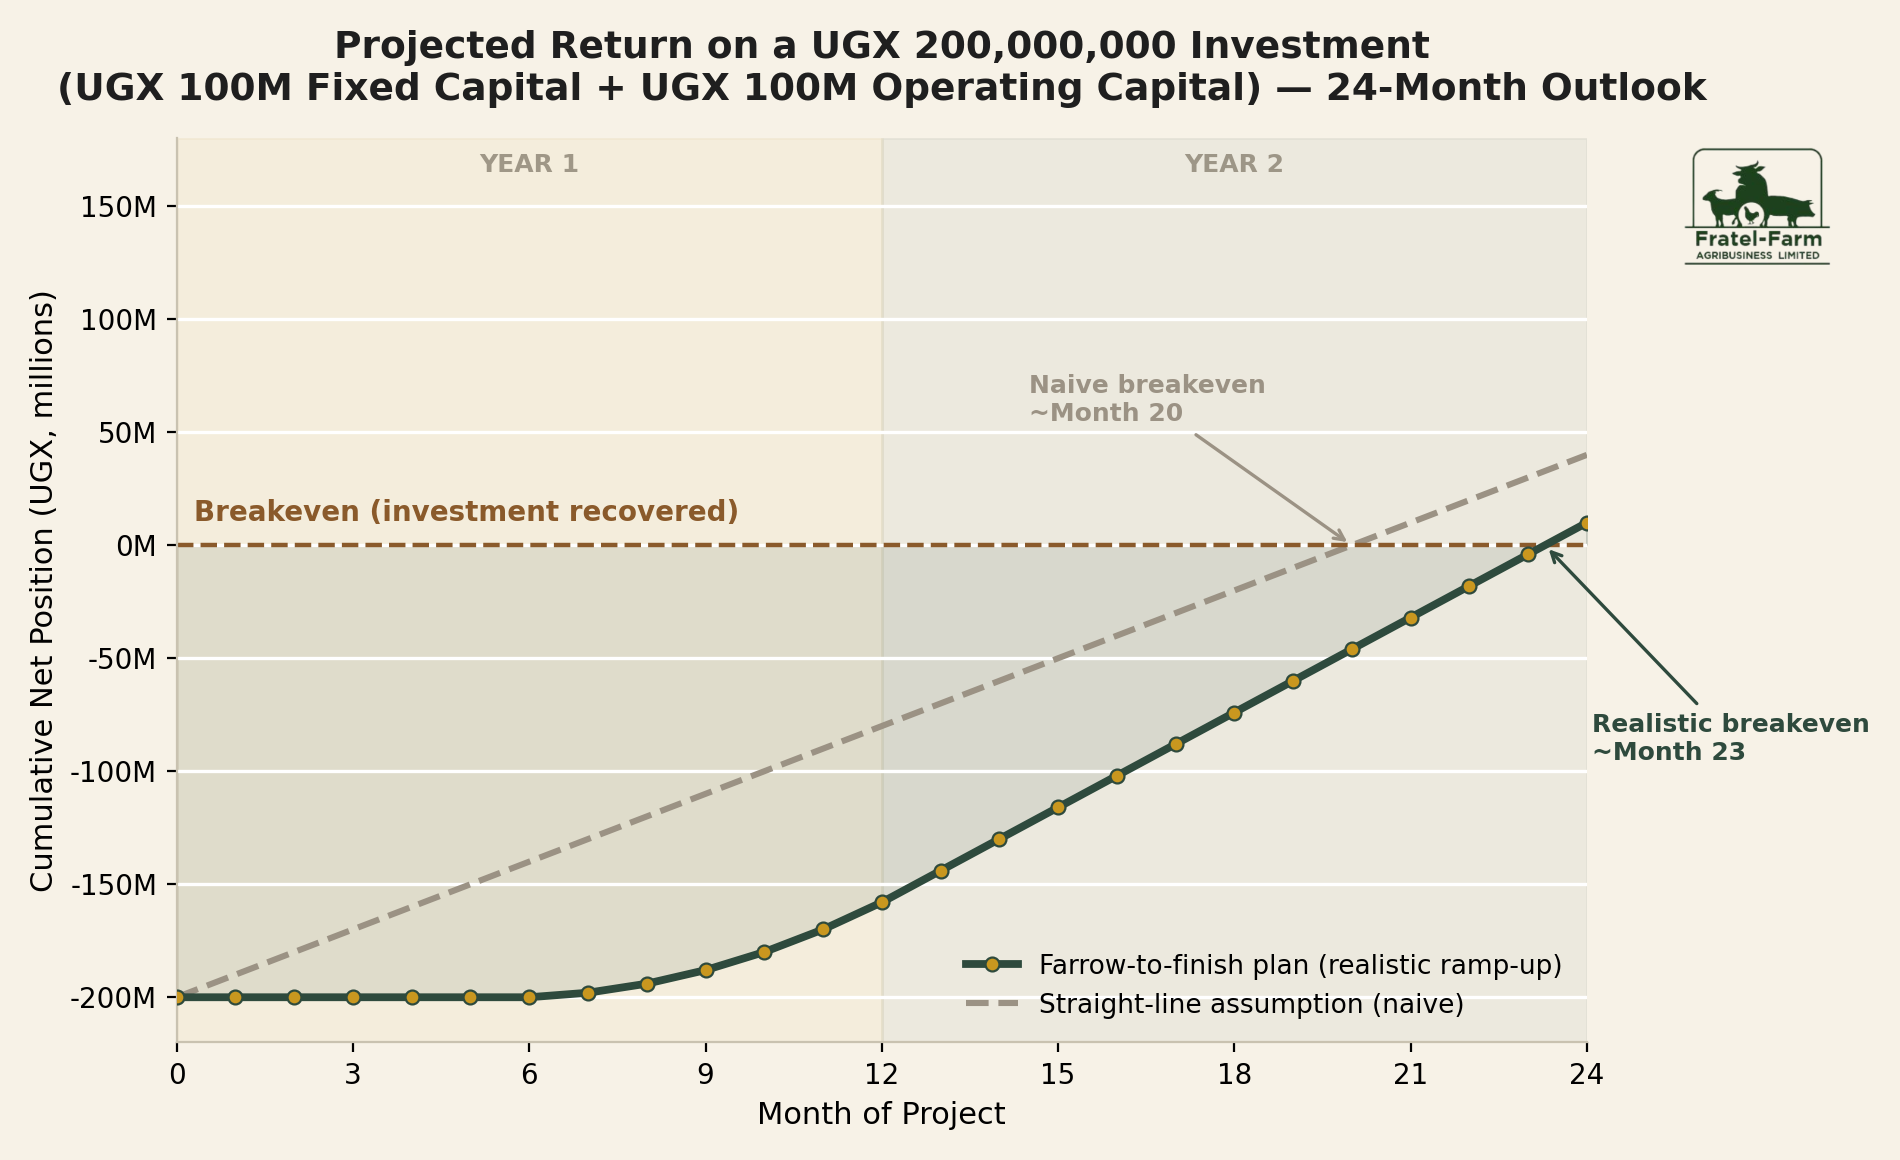
Three months doesn't sound dramatic until you're the one living inside it. Look at where the two lines separate: by month 12, the naive line is already climbing toward positive territory, while the realistic curve is still sitting near UGX -160M. That's not a rounding error — that's the entire back half of Year 1 where a farmer working off the wrong chart would expect income that simply isn't there yet.
Notice the shape of the realistic curve, too. It stays nearly flat for the first six months — the capital goes out, almost nothing comes back — before it starts climbing. That flat stretch is where new piggeries run into trouble. Not because pig farming doesn't work. Because the plan never drew that flat stretch in the first place, so nobody budgeted to survive it.
🔍 Where Homemade Projections Usually Go Wrong
Flat feed costs, not rising ones
As we covered in Episode 2, feed conversion gets less efficient as pigs grow — the last kilograms before market weight cost more to produce than the first. Most homemade budgets use one average feed cost for the whole cycle, which understates spending right when it matters most and quietly pushes real breakeven further out than the plan admits.
No allowance for mortality
Even a well-run farm loses some animals — disease, stress, accidents. A projection built on "every piglet survives and sells" isn't a projection, it's a best-case scenario wearing a projection's clothes. Every animal lost is capital that already left the farm and isn't coming back as revenue.
Assuming full capacity from day one
Real farms ramp up. Sourcing good breeding stock, getting housing right, and building buyer relationships all take time. On our UGX 200M example, that ramp-up is exactly what stretches the flat opening months of the realistic curve — a plan that assumes maximum output starting month one sets an expectation the farm can't hit yet.
No buffer for the slow first cycle
Setup costs land early — structures, initial stock, equipment — while sales income doesn't arrive until the first batch reaches market weight, months later. In the example above, that's roughly the first six months where cumulative position barely moves off UGX -200M. Without operating capital set aside to survive that gap, farmers get squeezed right when they can least afford it.
Treating fixed and operating capital as one pool
Fixed capital — housing, equipment, breeding stock — is spent once and depreciates slowly. Operating capital — feed, labour, veterinary care — has to keep flowing every single month, ramp-up or not. Lump the two together in a single number and you lose the ability to answer the one question every lender asks: how long can you keep operating before revenue catches up?
🏦 Why This Matters Beyond Your Own Planning
If you're seeking a bank loan, an investor, or a grant, this gap is exactly what a reviewer is trained to look for. A proposal that shows a straight line to profit reads as inexperience — or worse, as a number nobody actually stress-tested. A proposal that shows the realistic curve, names the three-month lag, and explains how the farm will fund itself through it reads as a farmer — and an operator — who actually understands the business.
Put yourself on the other side of the desk for a moment. A loan officer or investor sees dozens of piggery proposals a year, and almost all of them show the same optimistic straight line. The ones that get funded are the ones that show they know exactly where the valley is, exactly how deep it goes, and exactly what covers it. That's not a nice-to-have detail — it's the difference between a proposal that gets a follow-up call and one that gets filed away.
Getting this right isn't guesswork. It's what determines whether your proposal gets taken seriously — and whether the capital actually shows up when you need it.
🧮 What a Realistic Projection Actually Requires
Building the curve you see above isn't a matter of adding a "pessimism" adjustment to a spreadsheet. It means modeling your specific scale, your specific breeding and finishing timeline, and your specific cost structure — month by month, not year by year. That's the part most homemade plans skip, not because farmers are careless, but because it genuinely takes financial modeling experience most farm operators haven't had reason to build. It's also exactly the part a reviewer checks first.
We Build the Proposal That Accounts for the Valley
If you're planning to start or expand a piggery — or you already have a plan that's starting to feel optimistic — we put together bankable business proposals modeled on your actual scale and budget, not generic templates. The chart above is the kind of analysis your proposal should be built on.
- Startup cost breakdown split by fixed vs. operating capital
- Realistic feed-cost curve, not a flat average
- Month-by-month breakeven timeline that accounts for ramp-up and mortality
- Naive-vs-realistic comparison, so you can show reviewers you've stress-tested your own numbers
- Cash flow projection built to survive the slow first cycle
If your current plan only shows the naive line, you're not ready to submit it yet — and you're not alone; almost every farmer's first draft looks that way. Let's build the version that gets taken seriously.
Get Your Proposal Started →